How to use subscription analytics to unlock data-driven optimizations and max out ROI
The eCommerce landscape is ever-changing, but it’s safe to say that the subscription-based business model is here to stay. For customers, they’re a means to convenience, savings, novelty, and exclusive experiences — and for brands, subscriptions are the foundation of high-value customer relationships and more recurring revenue.
But make no mistake. The brands reaping the rewards of recurring subscription revenue aren’t making decisions in a vacuum. They’re not relying on instinct or luck to dazzle subscribers, either.
The secret is mastering subscription analytics so you can do more of what’s working, and less of what’s not. In this article, we’ll walk you through exactly what you need to know to tap into your own goldmine of subscriber insights.
What do we mean by subscription analytics?
Subscription analytics are the key to unlocking the valuable data-driven insights brands use to understand trends in subscriber behavior, and optimize their subscription experience accordingly.
By benchmarking and monitoring progress on relevant KPIS, brands can take the guesswork out of how to increase enrollment, maximize retention, boost average order value (AOV) — and anything in between.
What you can learn from subscription analytics
Subscription analytics puts the answers to important business questions like the ones below on a silver platter.
How to forecast and optimize revenue
By monitoring subscription analytics data like number of subscribers, AOV, churn rate, along with the other metrics we’ll cover shortly, you can zero in on patterns in subscriber behavior to accurately forecast revenue and make data-driven decisions about products and pricing to maximize profitability.
Why and when subscribers churn
As a rule of thumb, retaining customers is more cost-effective than acquiring new ones — and subscription analytics can help you spot trends by tracking subscriber groups over time so you can take proactive measures to save money by boosting retention.
Using subscription analytics to track subscriber cohorts can shed light on the effectiveness of promotions, seasonal purchasing trends, and even reveal the drop-off points where subscribers are most likely to cancel their subscriptions.
Effective ways to personalize the subscriber experience
Counterintuitive as it may be, 52% of consumers expect an even better experience from brands in a tight economy — and 65% are prepared to stop buying from brands who can’t deliver on their expectations for a personalized shopping experience.
Analyzing subscriber data is the first step in hooking customers with personalized offerings tailored to their unique needs and preferences. In practice, that can look like product recommendations based on past purchases, hyper-relevant discounts and promotions, or even targeted marketing messaging designed to appeal to subscriber’s interests.
Improved inventory forecasting
Predicting inventory and fulfillment needs is mission critical for strategic planning and ensuring long-term success.
Subscription analytics can provide valuable insights into the kinds of subscriber behaviors and seasonal trends that allow brands to forecast inventory and resource needs from month to month and quarter to quarter — and avoid headaches like excess products to store, or worse: not enough products on-hand to satisfy demand.
6 metrics to look for in subscription analytics software
With the right subscription analytics software, it’s easy for brands to track key metrics and keep valuable insights at their fingertips — no degree in data science needed.
With so many customer lifecycle metrics out there to track, the right areas to monitor will look different for each brand. But to be sure you have all the data you need to deliver a show-stopping subscription experience, these are the metrics you should look for in a subscription analytics software.
1. Enrollment rate
Enrollment rate tracks the percentage of checkouts that include subscription products relative to the total number of checkouts, and it can be tracked at the subscription or subscriber level:
Subscription enrollment rate = # of subscription checkouts on a subscription eligible product / # of all checkouts (one time + subscription) on a subscription eligible product
Subscriber enrollment rate = # of unique customers checkouts with a subscription on a subscription eligible product / # of all checkouts (one time or subscription) on a subscription eligible product
For businesses offering subscriptions alongside one-time purchases, this metric is a must for understanding the efficacy of subscriber incentives and other campaigns focused on subscriber acquisition.
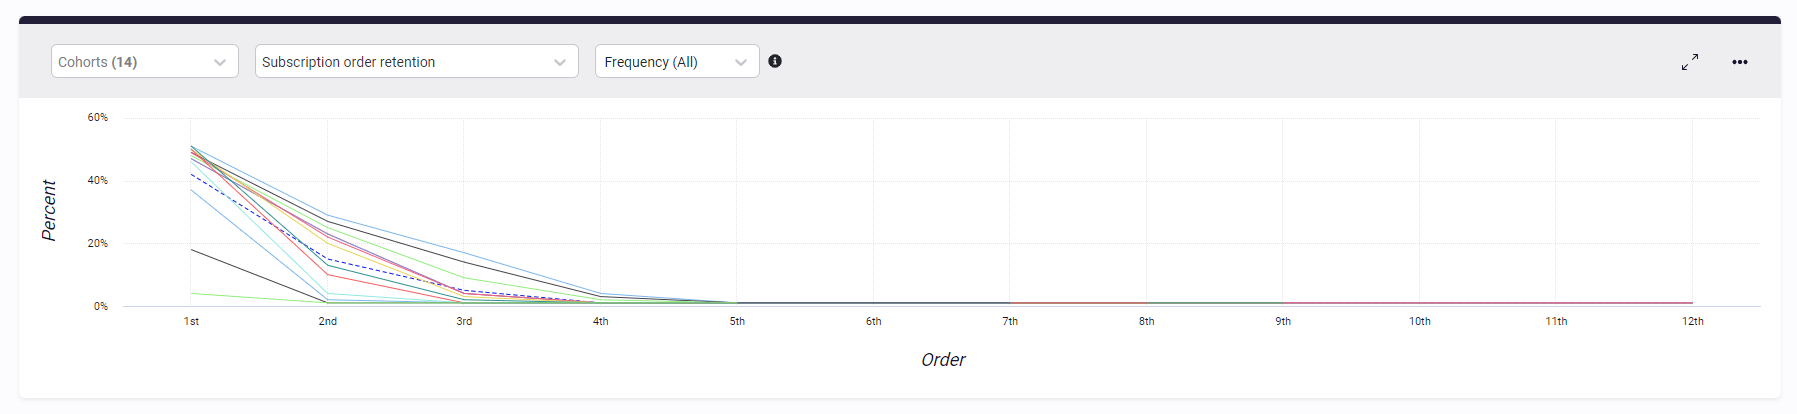
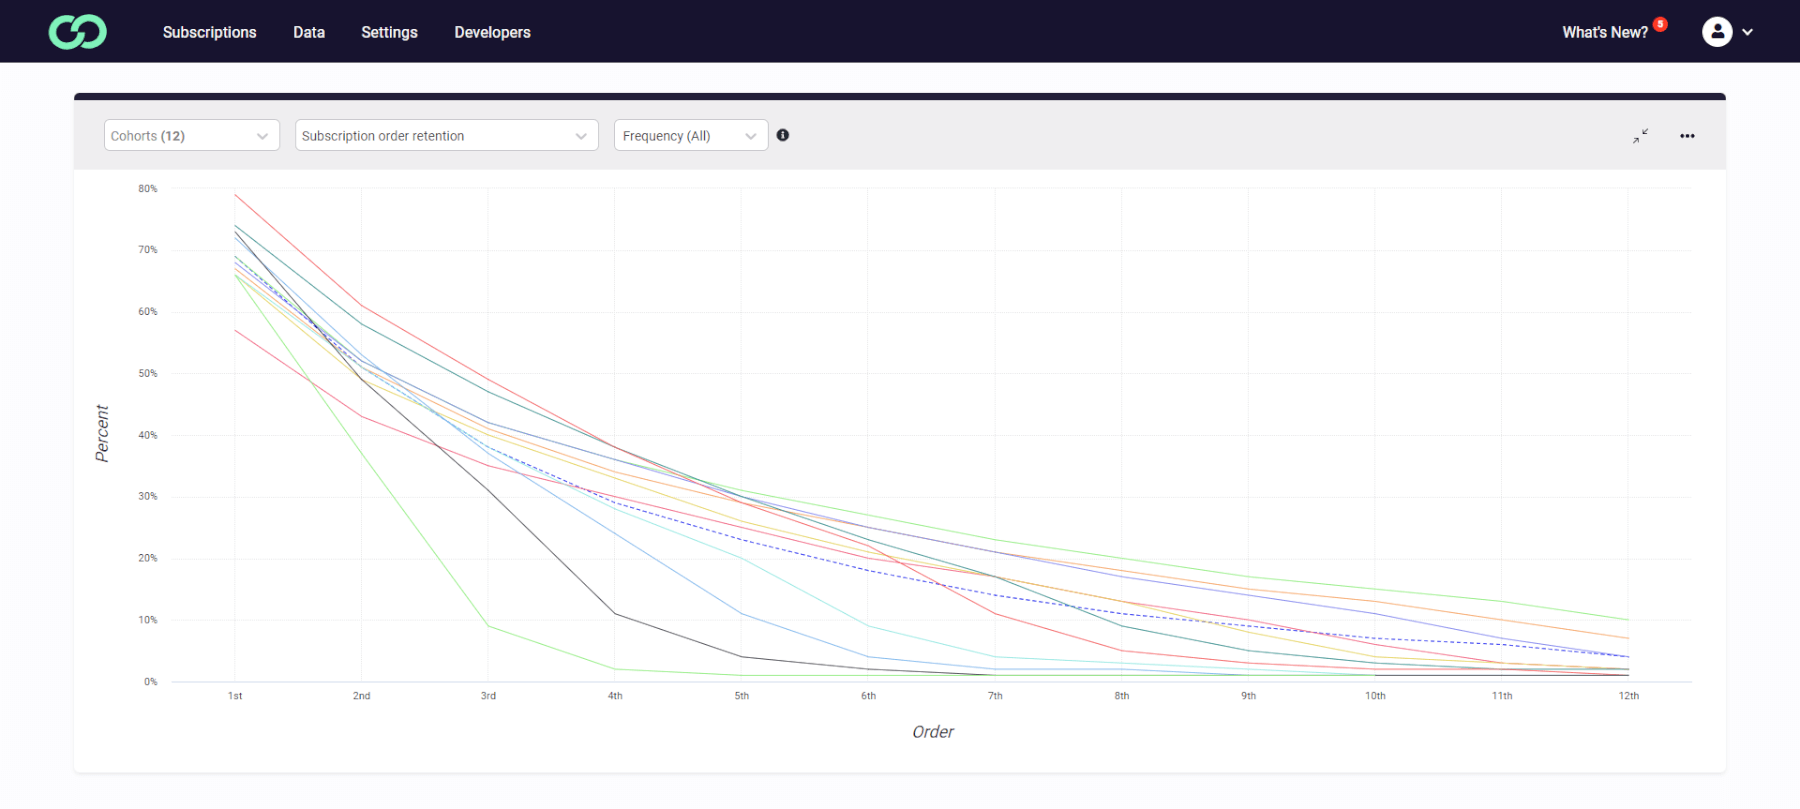
2. Subscription order rate retention
Subscription order rate retention is a key metric for subscription-based businesses, measuring the percentage of subscriptions that stay active after the initial order. This metric, which only includes subscribers who received their initial order, is a strong indicator of customer satisfaction and the appeal of the product or service.
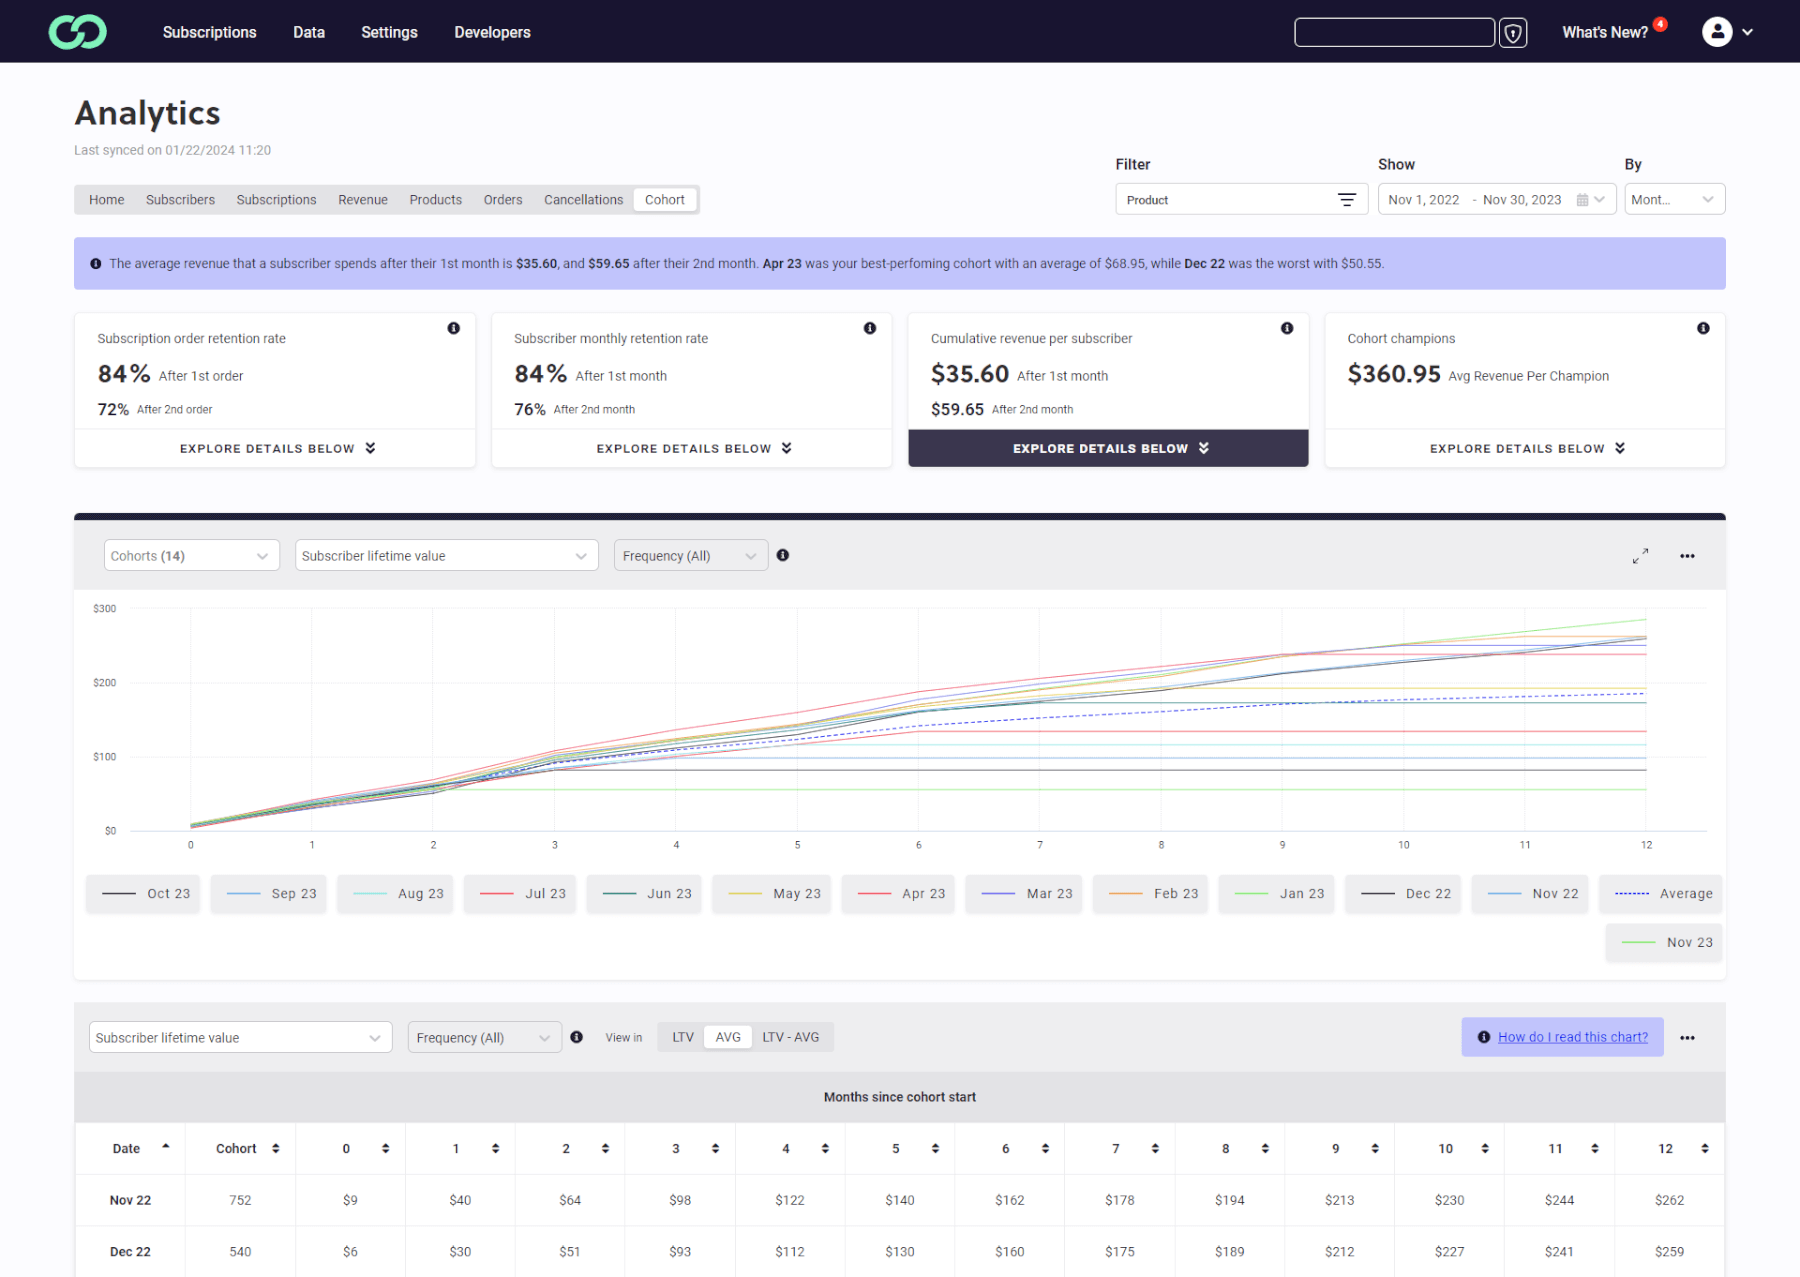
To add another layer of insight, it’s essential to consider looking at cohort reports. By associating the start date of each subscription with a specific cohort, businesses can more effectively analyze and understand how different groups of customers behave over time. This is crucial for calculating unit economics and gaining a deeper understanding of customer loyalty and value.
Additionally, comparing repeat purchasers and their number of orders with the subscriber cohort can provide deeper insights into customer behavior and loyalty.
The formula for calculating this metric is:
Subscription Order Rate Retention = (Number of Active Subscriptions after X Order / Number of Initial Subscriptions) x 100
A high retention rate signals customer satisfaction and the value of the subscription, while a low rate may point to issues in product quality, customer service, or value. If a high drop-off is observed at a specific order number, offering flexible incentives at that point can help in retaining customers.
Monitoring and analyzing this metric, along with repeat purchase behavior and cohort data, helps businesses pinpoint and address areas needing improvement, such as product enhancement, customer service upgrades, or pricing adjustments. Maintaining a high subscription order rate retention, especially within key cohorts, is crucial for the long-term viability of subscription models.
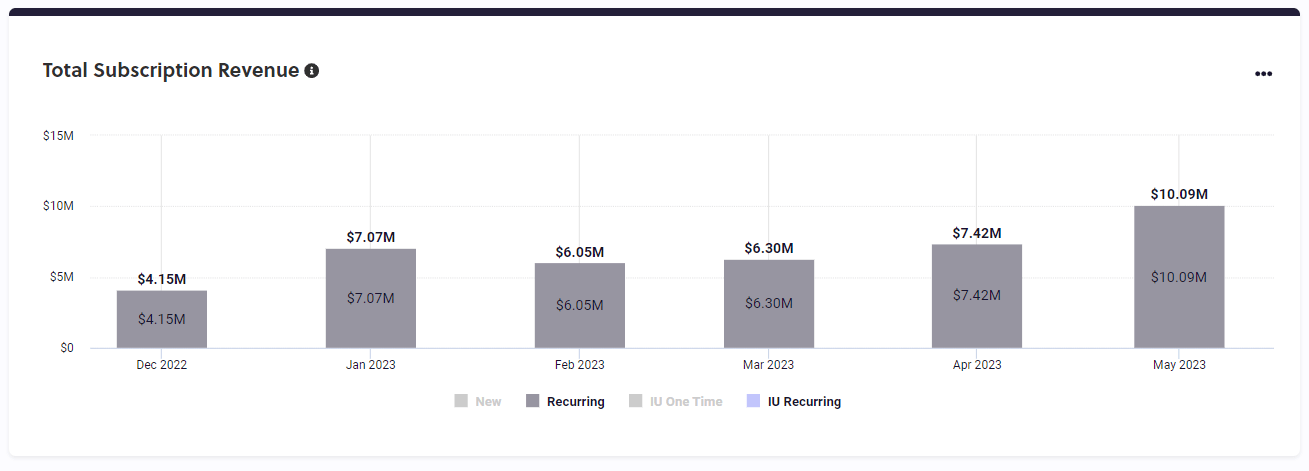
3. Monthly Recurring Revenue (MRR)
Arguably the holy grail of subscription analytics, MRR is what tells you exactly how much revenue your subscription experience brings in each month. It provides a snapshot of overall business health and helps predict cash flow based on subscriber enrollment and churn.
MRR is calculated by multiplying the number of enrolled subscribers by the average monthly revenue per customer. If you have 2,000 subscribers at the end of a given month, and subscribers spend on average $45 per month on subscription orders, then your MRR would be $95,000.
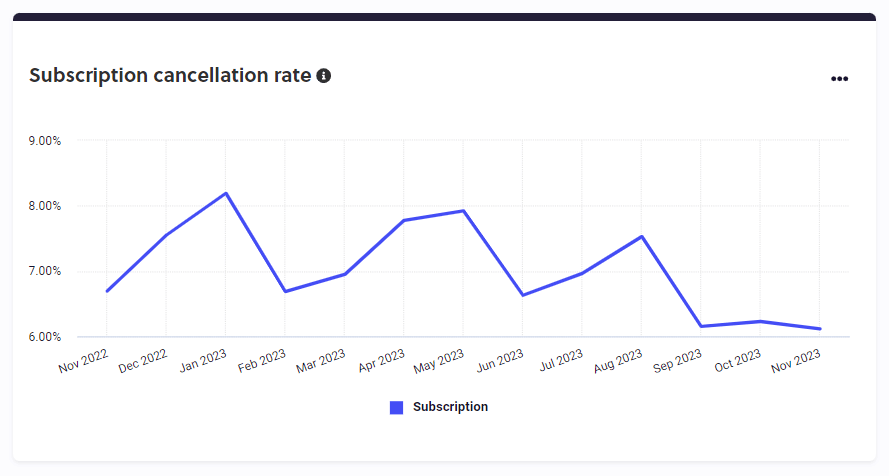
4. Churn rate
Churn rate, sometimes referred to as cancellation rate measures the percentage of subscribers who cancel within a given period.
It’s calculated with a simple formula:
Annual churn rate = (Number of customers or subscriptions at start of year – Number of customers or subscriptions at end of year) / Number of customers or subscriptions at start of year
A high churn rate can significantly impact your business by depleting the number of people in your program. This effect becomes particularly concerning when the churn rate exceeds the customer acquisition rate, leading to a net negative impact on your program. It’s crucial to monitor this metric closely, as it can eat away at recurring revenue.
Promptly addressing factors that contribute to subscriber attrition is essential for maintaining a healthy subscriber base and ensuring the sustainability of your subscription model.
5. Customer lifetime value (CLV)
The lifetime value of a customer is the other piece of the puzzle when it comes to quantifying the efficiency and value of your subscription offering. It quantifies the total amount of revenue an existing customer will provide over the course of their lifecycle — and understanding that figure is particularly relevant when you have recurring subscription orders coming in.
Calculating CLV can be simple or complex depending on the nature of the business. A common formula is below:
CLV = (AOV x Total Lifetime Orders) x Gross Profit %
If your average customer stays with your brand for about three years and makes six purchases worth $50 in that time, and your gross profit margin is 60%, your CLV would be 6 x $50 x 60% = $180.
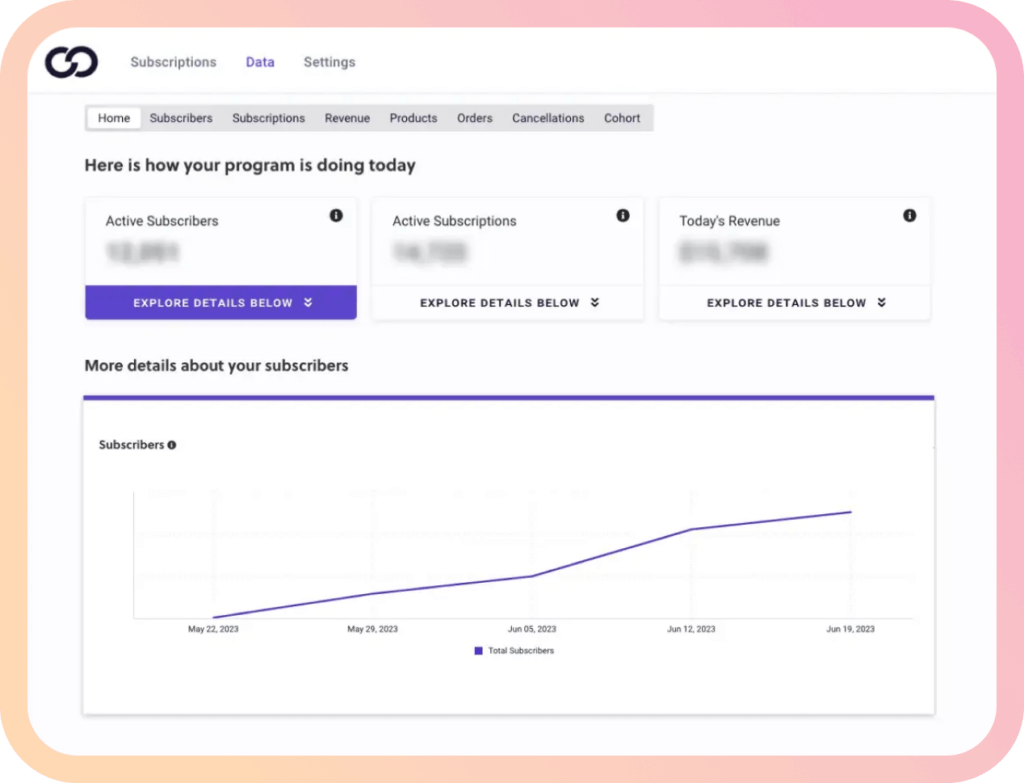
6. Subscriber base growth
This metric tracks the number of active subscribers you have over time in the interest of monitoring and forecasting growth over specific time periods.
The simple formula below can be tweaked to calculate subscriber base growth over any number of months or years:
Subscriber base growth = [(# of subscribers at the end of timeframe X – # of subscribers at the beginning of timeframe Y) /# of subscribers at the beginning of timeframe Y] x 100
Combined with customer segmentation and subscriber cohort analysis, this metric can help point to answers about why and when subscribers churn — and even inform revenue forecasts.
Best practices to get the most out of subscription analytics
Factions of loyal customers. Preventing churn before it starts. Revenue forecasts you can count on. Subscription analytics software makes all of these things easier to achieve by putting key metrics on a silver platter.
No matter which software you choose, there are still a few best practices to keep in mind if you want to be 100% confident in the data you’re using to make business decisions.
Aim for seamless data integration
Subscription analytics work best when your subscription solution integrates seamlessly with the rest of your tech stack. If your subscription data doesn’t play nicely with your eCommerce platform, marketing automation provider, or any other engagement tool you use, you run the risk of making decisions based on incomplete information.
Go deeper with segmentation
Similar to the case for seamless data integration, segmentation captures another layer of detail so you can feel certain that your data’s telling the whole story.
Segmenting subscribers into categories based on their demographics, purchasing behaviors, and individual interests will let you conduct a more targeted analysis. That’s how you reveal deeper nuances and make more valuable optimizations to the subscriber experience.
Don’t forget to A/B test elements of the subscriber experience
The beauty of subscription analytics is taking the guesswork out of what’s working and what’s not. A/B testing takes that a step further by empowering brands to test changes or innovations within the subscriber experience and determine the winning variation.
The results of these tests can tell you exactly what to dial up or down for maximum effect — like which type of promotion works best for different subscriber cohorts, or the best places to offer subscription enrollment on your website.
How top brands fuel their growth with subscription analytics software
It’s easy to see the value of subscription analytics in theory, but imagining how it could look in practice for your brand might be a different story. Here are some concrete examples of leading brands using Ordergroove’s subscription analytics to max out the value of their subscription experience.
Bonafide built a subscription-first brand on data-driven insights
Bonafide is a natural remedy brand that provides women with relief from menopause symptoms — the majority of whom are loyal monthly subscribers or prepaid bulk subscribers.
With their subscriptions gaining traction after switching to Ordergroove, Bonafide saw an opportunity to double down on recurring revenue and become a subscription-first brand.
“We have very, very rich data to understand the reasons that are driving our subscribers to cancel, which helps to inform our win-back strategy,” said Kiara Sanchez-Mora, Sr. Director of Lifecycle and Retention at Bonafide. “We are incredibly successful at that. We get a very large percentage of our customers to come back to us and to subscriptions after we learn how to improve their experience.”
Good Ranchers uses subscription analytics to do more of what works
When Good Ranchers came to Ordergroove, they had a 50/50 split of subscribers to one-time purchasers for their deliveries of the best meat America has to offer. Thanks to valuable insights they gleaned from Ordergroove’s subscription analytics, 80% of their sales are subscription orders.
“Numbers tell you a story, numbers give you the ability to make changes, and so the numbers and analytics that Ordergroove provides have been instrumental in taking us to that next level,” said Jermain Gil, COO at Good Ranchers.
A big part of that is the ability to test multiple offers and monitor the data to pinpoint which one boots acquisition and retention.
“We find it helps immensely with our conversions,” Gil said. “We’ve seen growth in our average order value and lifetime value, as well as just the length of the subscriptions.”
La Colombe uses data to continually grow and optimize their subscriptions
La Colombe came to Ordergroove for features that would rapidly grow their subscriber base and average order value (AOV) — but they stayed for the robust and intuitive analytics.
La Colombe combs over their self-service subscription analytics dashboard to maintain the high bar they set for subscription performance. And there’s lots to love about having KPIs for revenue, cancellations, product performance, enrollment, and more, all in one place.
“Our first subscription platform had analytics, but they weren’t intuitive and were stressful to use,” Emily said. “Ordergroove has been huge in helping us figure out how our program is performing and making decisions for the next month or even six months out.”
Take the guesswork out of subscription revenue
As some of your most loyal customers, subscribers have high expectations that deserve to be met. Offering them a subscription experience and hoping for the best is one thing. Understanding exactly how it’s performing — and using those insights to optimize it accordingly — is quite another.
With metrics that shine a light on how to improve customer loyalty, prevent churn, and accurately predict cash flow, there’s no need to waste resources on costly guesswork and trial and error.
Join the leading brands letting Ordergroove’s subscription analytics illuminate the powerful data-driven optimizations that set their subscription experience apart, turn your business into a well-oiled, revenue-generating machine.